


In the Time of Coronavirus: Nonprofits, Cash, and Lifelines
by Jeff Williams and Tamela Spicer

How many Michigan charitable, 501(c)(3) nonprofits have two or more months of cash on hand to cover normal, average monthly expenses — and what should organizations at risk be doing now?
That was our follow-on question to the Johnson Center’s recent post about risks facing Michigan’s nonprofits. For our last analysis, we used IRS 990 tax filings from 2015, but to look at cash on hand, we uploaded, sorted, and analyzed tax returns from 2017. This new data is the most recent full year available, and gives us data on the cash, short-term cash equivalents, and investments held by the universe of reporting nonprofits[1] that we didn’t have for 2015.
We know that nothing about the world today is “average” or “normal” for either revenue or expenses. For some frontline organizations, costs have skyrocketed as they work to meet unprecedented, unforeseeable demand for basic services. For other types of nonprofits, revenue has fallen drastically as events and programs have been canceled or postponed. So, readers should treat the following analysis as a picture of what Michigan’s nonprofits looked like entering the crisis, not a diagnosis of how they are doing today.
Michigan’s nonprofits have on hand an average of one month of cash and 3.8 months of cash and cash equivalents (savings accounts and other short-term investments). But averages can be swayed both by nonprofits with zero cash on hand, as well as nonprofits with large cash stockpiles. Therefore, a better view is to look at the median number of months of cash on hand, which identifies the midpoint where half of nonprofits have more and half have less.
The median number of months of cash on hand for Michigan charitable nonprofits is two months — 5.5 months including cash and cash equivalents.[2]
To put that in a national context, a January 2018 report from the firms Oliver Wyman, SeaChange, and GuideStar found that, “half of nonprofits have one month of operating reserves and less than six months of cash to keep them running.” Therefore, Michigan’s nonprofits are comfortably normal — especially compared to national peers.
Here are the patterns we observed for nonprofits facing substantial cashflow challenges.
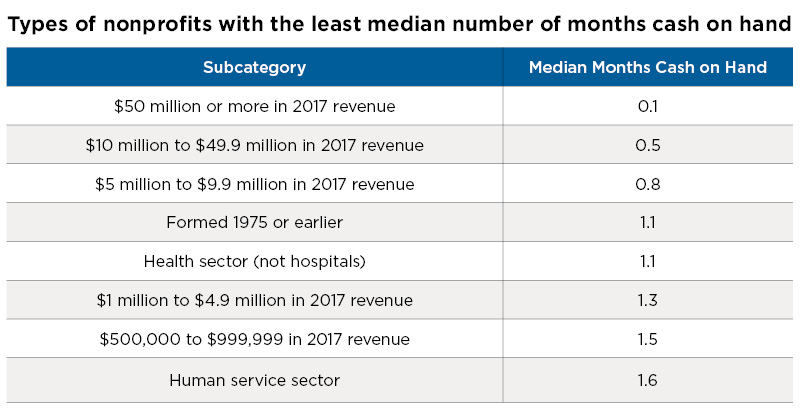
The larger the nonprofit by revenue, the less cash (or cash + savings) on hand — sometimes falling to dangerous levels.
As discussed in a previous blog post, larger nonprofits rely much more heavily on program service revenue — which likely means they use cash flow from program services as a source of funding instead of a more traditional “rainy day” fund. Larger nonprofits also are more likely to have access to lines of credit secured by that cash flow. That is perfectly normal and reasonable… until programs are put on indefinite hold.
Arts and Education nonprofits are in good shape, with a median of 1.9 to 2.7 months’ cash on hand.
These figures rise to 4.9 to 7.1 months’ cash on hand when including cash equivalents. Arts organizations — on the whole — have done a good job at building rainy day funds which are very useful when event attendance goes to zero (or near zero on a paid admission basis).
Health and Human Services nonprofits’ median number of months of cash on hand is less than a typical nonprofit — 1.1 months (health) to 1.6 months (human services).
This increases to 4.2 to 4.4 months’ cash on hand when we add in cash equivalents. This factor will be critical in the survivability of a typical health or human service organization during the stay-at-home period.
Younger organizations have more months of cash on hand than older organizations. Organizations founded before 1975 have 1.1 months’ cash on hand and 3.0 months’ cash and cash equivalents on hand — compared to 2.5 months and 5.3 months, respectively, for organizations founded in 2015 or later.
The data also highlights that one-third (33%) of Michigan’s charitable nonprofits have less than one month of cash on hand — and another 16% have only 1.0 to 1.9 months of cash on hand.
The organizations with less than one month of cash on hand employ two-thirds of the sector’s employees.
More than 163,000 employees — or 63% of the reporting total — work for nonprofits with less than one month’s cash on hand. Those same organizations pay $4.8 billion each year in salaries and benefits. Until these nonprofits are operational again, employment will be at risk.[4]
Engagement will suffer until these organizations are operational — and volunteers feel safe.
These large-employing nonprofits reported engaging 431,622 volunteers — nearly half of the 1 million volunteers reported on all Michigan 990 tax returns. While these numbers include duplicate counts as individuals volunteer for multiple nonprofits, again, roughly half of the volunteer workforce is engaged with organizations that have less than one month of cash on hand.
Data is a useful tool for leaders in the nonprofit sector — but it comes with a limitation, as data cannot tell leaders precisely “what” to do during an emergency. When data is combined with rigorous analysis and the experience of practitioners, however, it can show you where to start.
Remember, too, that in times of crisis people often do first, manage second, communicate third, and then — and only when time is available! — plan and set goals. That’s precisely backward; as a leader, you should plan and set goals first, then communicate, then manage, then do… especially in a crisis.
Here are some action steps to consider:
Now is the time to press into relationships.
Talk to your key donors, funders, and program partners. They want to know what you are doing, and what you need. Don’t be afraid to ask for help or even additional funding; just be sure the ask is specific and appropriately aligned with your plans.
Keep meeting with your board of directors — and your staff.
Articulate who your organization is, and how staff can be helpful both now and when the economy is reopened. Mission-focused scenario planning is key during this time. Ask all of the “what if” questions and engage both board and staff in creating an action plan for each scenario, complete with decision-making deadlines. This will minimize reactionary decisions that often cost more in the long run.
Engage your finance director and/or accountant in financial forecasting.
Consider these questions with your board and staff:
○ All six months look exactly like March or April 2020
○ The first three months look like March/April 2020, and in the last three months we steadily improve to “normal” by month seven
○ The first three months look like March/April 2020, and in the last three months we recover half of our total decline by month seven
○ Savings and short-term investments
○ Long-term investments, including the principal of endowment accounts as either a grant or loan
○ Government-backed loans
○ Financial institution-backed loans (banks and credit unions)
○ Special appeal to your closest and/or largest donors
○ COVID-19-related relief funds from foundations
Work with staff, board, and partners to evaluate the viability of your programs under the various scenarios.
○ Which programs that are a current priority are still relevant and need to continue at each stage of the pandemic, during re-entry, and into recovery — perhaps with adjusted delivery methods
○ Which programs should be put on pause to resume when the crisis is over
○ Emerging priorities that align with your mission for consideration, but not right now
○ Unknown status/need more data to decide
○ Which programs to honor and let go
Organize and articulate your organization’s story in phases.
Document learnings as you go.
Both community and organizational needs are likely to look different when we emerge from this crisis. As you adjust program delivery, staff, partnerships, and other items, be mindful of what you are learning that can help you innovate in the future.
Here are some action steps to consider:
The cash-on-hand analysis says you should pay particular attention to larger organizations ($5 million in annual revenue or more), older organizations (founded before 1975), health as well as human services organizations, and any organization with less than one month of cash (not cash + equivalents) on hand.
Why? Because — especially for larger and older organizations — nonprofits with less than one month cash on hand employ the largest proportion of Michigan’s nonprofit workforce.
Reach out to existing grantees to strategize about flexibility for current grants.
Help convene nonprofits (virtually, of course) to ensure basic needs are met throughout the crisis and beyond.
This may include encouraging short- and long-term, as well as both programmatic and organizational, collaborations.
Support capacity building as organizations prepare for re-entry and recovery.
We are in unprecedented times. Half of Michigan’s nonprofits likely entered 2020 with less than two months of cash on hand — and one-third of the state’s nonprofits entered with less than one month of cash on hand. If these cash-poor organizations permanently cease operations, the follow-on employment effects in the sector could be staggering since they represent two-thirds of the sector’s employment. As other organizations such as restaurants and businesses struggle to reopen, nonprofits must be able to address community gaps in human services.
Now is the time for regular communication, scenario planning and review, and creativity.
_______________
[1] Nearly 470,000 Michigan residents work in the nonprofit sector, according to a 2018 analysis from Public Sector Consultants on behalf of the Michigan Nonprofit Association. More than 100,000 additional employees work in hospitals and private higher education, which are intentionally excluded from the analysis in this paper so we could focus on a “typical” nonprofit.
[2] As of March 2020, there are 52,171 nonprofits in Michigan. Of these, 40,584 are certified as 501c3 (charitable) organizations. Of those charitable organizations, half reported revenue under $25,000/year (20,440 organizations), which means they file the 990-N “postcard” return. Only 9,208 of the remaining charitable organizations file the full 990 or the 990-EZ form — and of these, 7,702 were active in 2017, filed a return, and were not a hospital or institution of higher education. Of these, nearly two-thirds filed the full 990, and the remaining third filed the 990-EZ.
[3] The median for Michigan nonprofits is $73,500 in cash on hand, $130,000 in savings and short-term investments, and $36,900 in expenses each month.
[4] Cash combined with all investments is all that is available on the 990-EZ form. Only 990 filers break out cash, cash equivalents, and investment balances.