


In the Time of Coronavirus: What Is the Risk to Nonprofits Nationwide?
by Jeff Williams
In our first two posts of this five-part series, we focused on risks facing nonprofits and likely cash on hand. While that data was focused on Michigan, the lessons and findings were representative of nonprofits nationwide. We detoured briefly in the third post to look at endowments as a resource for recovery for communities from COVID-19.
Johnson Center researchers have now processed the public tax returns for 290,066 charitable nonprofits[1] in every state and the District of Columbia — and have found (as we expected) that the median results from Michigan are indeed a very common result across the nation. We use the 2017 tax year filings — the most recent complete tax year available — to get a feeling for where nonprofits likely started 2020… right before we all encountered the world of COVID-19.
For more information about the methods to download and analyze the data, please see the earlier posts, with additional information providing the national summary statistics below.[2]
Nationally, non-hospital and non-university charitable nonprofits filing the IRS 990 have on hand a median of 2.2 months of cash and 4.5 months of cash + savings (savings accounts and other short-term investments considered cash equivalents). As noted previously, we report medians, not averages, because averages can be swayed both by nonprofits with zero cash on hand, as well as nonprofits with large cash stockpiles. Therefore, a better view is to look at the median number of months of cash on hand, which identifies the midpoint where half of nonprofits have more and half have less.
However, the median analysis also means — by definition — that half of U.S. IRS 990-filing nonprofits likely started 2020 with less than 2.2 months of cash on hand.
As we observed in the Michigan-only analysis, the larger the nonprofit by revenue, the less cash (or cash + savings) on hand — sometimes falling to dangerous levels. Small nonprofits ($10,000 to $499,999 in annual revenue), for instance, have a median of 2.8 to 8.6 months of cash on hand, a figure that rises to 4.9 to 29.5 months on hand when including cash equivalents.
But for larger nonprofits with $5 million or more in annual revenue, the median falls dramatically to 3+ weeks for the $5 million to $9.9 million revenue category, and one week for the $50 million or more category. When cash equivalents are included, figures improve to 2.1 months for the $5 million to $9.9 million group, and 1.4 months for the $50 million or more group.
Most likely, the difference between smaller and larger nonprofit cash on hand is because larger nonprofits have access to investments, lines of credit, and other financial instruments that stand in for cash (or cash + savings) in a traditional deposit account.
The sector is right to worry about low-cash nonprofits. Nationwide, as in Michigan, the organizations with less than one month cash on hand employ roughly two-thirds of the sector’s employees. Those same organizations pay $251 billion each year in salaries and benefits. Until these nonprofits are operational again, national employment will be at risk.
Table 1: Employees and volunteers, by cash category, nationwide
| Cash on Hand | Number of Nonprofits | Total Employees | Total Salaries and Benefits |
| Less than 1 month | 55,878 | 6,273,613 | $251,005,832,311 |
| 1 to 1.9 months | 28,049 | 1,611,253 | $53,237,066,994 |
| 2 to 2.9 months | 18,123 | 720,521 | $23,354,225,358 |
| 3 months or more | 67,737 | 1,012,000 | $32,347,333,546 |
| N/A or misc. other | 13,301 | 646,084 | $29,482,118,458 |
| Total | 183,088 | 10,263,471 | $389,426,576,667 |
National figures are helpful for an overall conversation — but averages can mask underlying variations in the data. Using the U.S. Census Bureau’s geographic definitions for U.S. regions, when we look by region, the regions are reasonably tightly grouped by both cash and cash + savings.
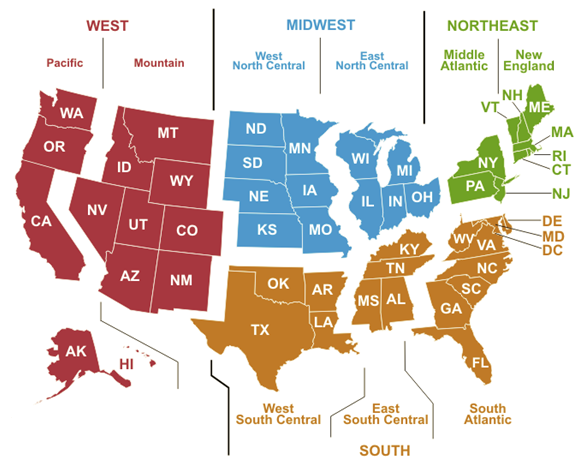
Table 2: Months, Cash and Cash + Savings, by Region
| Census Region | Number of Nonprofits | Median months cash on hand | Median months cash + savings on hand |
| Middle Atlantic Division | 30,058 | 2.0 | 4.4 |
| East North Central Division | 25,160 | 2.0 | 4.3 |
| West North Central Division | 14,747 | 2.0 | 4.9 |
| New England Division | 13,122 | 2.1 | 4.6 |
| Mountain Division | 12,038 | 2.2 | 4.3 |
| South Atlantic Division | 33,921 | 2.2 | 4.4 |
| Pacific Division | 29,315 | 2.4 | 4.7 |
| East South Central Division | 8,539 | 2.6 | 4.6 |
| West South Central Division | 15,898 | 2.8 | 4.9 |
| No region identified | 290 | 2.5 | 4.1 |
| Total | 183,088 |
A few key findings:
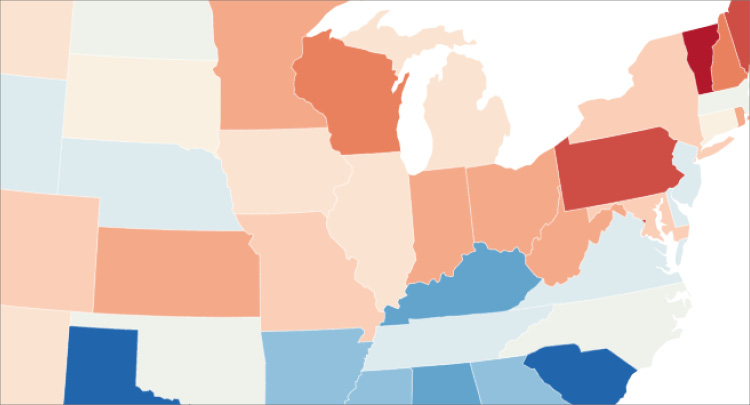
So, if we are looking for differences, they are simply not meaningful at a regional level… but they do appear at a statewide level. State medians run from 1.6 months at the low side (Vermont) to 2.9 months at the high side (South Carolina, Louisiana, and Texas).
Knowing readers might be curious how some of these statistics look for their individual state, we have provided a one-page summary for each state and the District of Columbia[3] that lists:
We’ve compiled all of the state-by-state statistics into one document that you can download, browse, and use in your work:
Since our second blog provided data for Michigan, we’ll go to the other end of I-75 and show the Florida summary below as an example of the state-by-state breakdown:
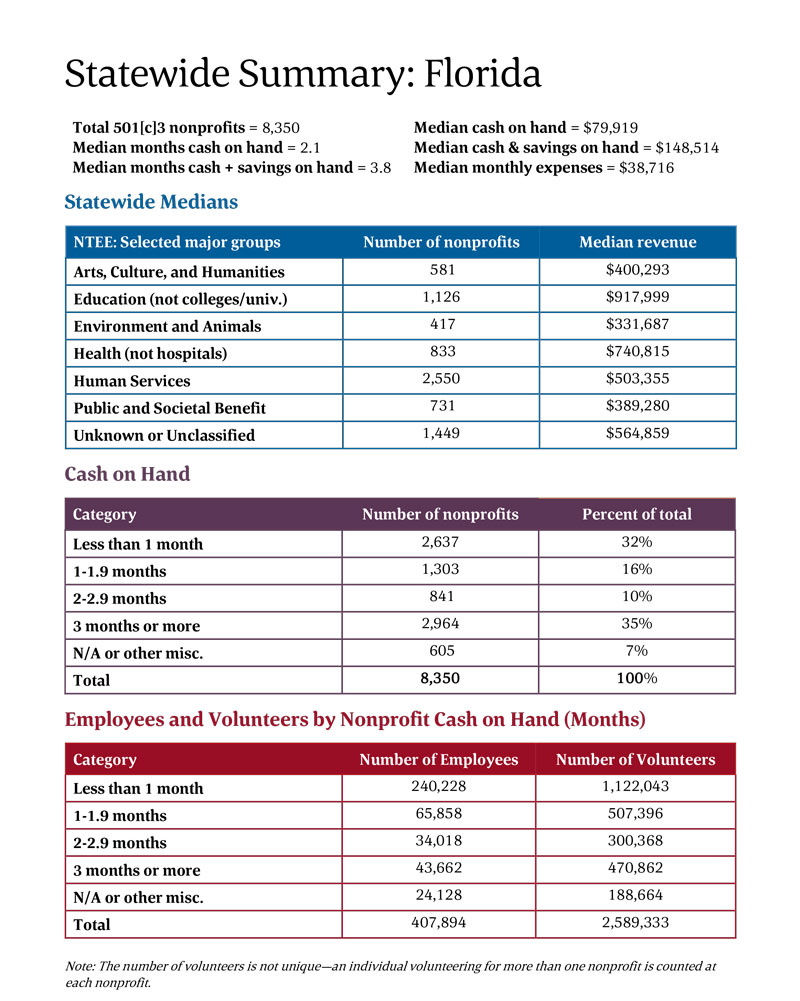
(Note: Careful readers will note that the Michigan median cash and cash + savings figures in the state-by-state summary here differ slightly from the analysis in the second blog post. The reason lies in the data cleaning rules applied to individual nonprofit tax returns. Since Johnson Center researchers are very familiar with a number of Michigan nonprofits, we quickly identified some oddities in the data for blog 2 and removed those nonprofits from the analysis. However, we do not have the same level of knowledge for every state at the national level. So for this blog, we applied uniform data cleaning rules to every state to ensure common treatment — and to make cross-state comparisons as meaningful as possible.)
While we hope this overview encourages the philanthropic sector to continue discussions about the financial stability of the sector, we recognize two important caveats.
First, there is more to financial health than cash (or cash + savings) alone. Liquid investments such as publicly-traded stocks, bonds, ETF, and mutual funds, as well as lines of credit, are additional financial instruments. Non-financial instruments—like a special campaign for donations and gifts, or raising the price of fee-for-service engagements — can also be key sources of cash and liquidity for nonprofits. For a more comprehensive view of organizational finances, we are fans of both the Johnson Center’s Financial Analysis in Grantmaking course from The Grantmaking School, as well as the work of leading nonprofit voices like the Nonprofit Finance Fund (NFF). NFF has a very good online worksheet that can help organizations conduct a financial self-assessment to gain a broad view of financial health to start conversations and decisions.
Second, there is no substitute for coupling any discussion about nonprofit finances with a review of the organization’s mission.
Finally, as a nation and as a sector, we continue to be in a time of uncertainty. Uncertainty creates fluid — and highly variable — situations, so organizations need to adapt. We have seen examples in the COVID-19 crisis of flexibility of personnel (some nonprofit staff figuring out how to deliver services in the absence of volunteers… while others deal with a flood of volunteers depending on the subsector) and of requirements (such as the quick response of many foundations to provide additional flexibility with active grants). See especially the first post in this series for more on this point — things will continue to be weird before they get better or worse… and the process of returning to “normal” will not be linear.
_______________
[1] For this analysis, as with the prior papers, we have intentionally excluded hospitals and private higher education — which often have comparatively large, and sometimes massive, revenues, assets, and employee counts — so we could focus on a “typical” nonprofit as understood by the general public.
[2] As of May 11, 2020, there are 1,757,420 nonprofits in the United States. Of these, 1,399,615 are certified as 501(c)(3) (charitable) organizations. Of those charitable organizations, roughly half reported revenue under $25,000/year (669,351 organizations, or 48% of the total), which means they file the 990-N “postcard” return. Only 340,189 of the remaining charitable organizations file the full 990 or the 990-EZ form — and of these, 290,066 were active in 2017, filed a return available in the IRS public data set, and were not a hospital or institution of higher education. Of these, nearly two-thirds filed the full 990, and the remaining third filed the 990-EZ.
[3] We are not able to include data for U.S. territories, or for all of the top 12 NTEE classifications, because some of the breakdowns would individually identify the nonprofit organization.