This blog is the first in a series of four that not only reminds us what things looked like in 1992, but also reveals how the practices of giving, the makeup and number of institutions, and the intensity and breadth of research and teaching about philanthropy have all expanded and changed in dramatic ways. For instance, megadonors have become much more mega, the lines between the sectors have blurred more than anyone expected, and most institutions for research about this field — and most university degree programs — have been established in the past three decades. Still, many other aspects of the field and its institutions have endured — and not always for the better.
Let’s explore what a difference 30 years can make in philanthropy.
Thirty years is not a long time for some fields — geology, for instance. But for philanthropy and the nonprofit sector — and especially the study of and training in those fields — thirty years is a big deal. Consider that the premier industry publication, the Chronicle of Philanthropy, was only founded in 1988. Also, most institutions for research about this field, and nearly all university degree programs, have been established in the past three decades.
The Center for Philanthropy and Nonprofit Leadership — now called the Dorothy A. Johnson Center for Philanthropy — was founded at Grand Valley State University in 1992. It seems fitting, then, on the occasion of our 30th anniversary, to look back at what things looked like at the beginning — as well as at the remarkable transformation and growth of the field since then.
“[M]ost institutions for research about this field, and nearly all university degree programs, have been established in the past three decades.”
Who was giving in 1992 and in what ways? What was the foundation world like in 1992? What stories were on the front page of the Chronicle of Philanthropy? How many other university-based centers were there at the time? And how does this compare to the current landscape of giving, nonprofits, and philanthropic studies?
This essay not only reminds us what things looked like in 1992, but reveals how the practices of giving, the makeup and number of institutions, and the intensity and breadth of research and teaching about philanthropy have all expanded considerably and changed in sometimes dramatic ways.
Megadonors have become much more mega, the lines between the sectors have blurred more than anyone expected, and many more academic programs have opened their doors. Still, many aspects of the field and its institutions have endured — not always for the better. Nonprofit ethics scandals remain in the news as they were 30 years ago, and we still struggle with how to address persistent social and racial inequities. However, the overriding theme here is the incredible expansion and change in these past thirty years.
According to our best annual estimate of charitable giving, in the publication Giving USA, total giving from all sources in 1992 was $124.31 billion. In 2021 (the latest year calculated), that total rose to $484.85 billion, an increase of $360 billion over 30 years.
However, this increase is not as astonishing as it might seem because the total giving figure has continued to track closely with the size of the overall U.S. economy. Giving now is roughly 2% of the national GDP, just as it was 2% back in 1992. As the economy grew, so did giving.
What has changed is the mix of charitable sources, as shown in Table 1. The most dramatic change is in the relative amount of total giving coming from individuals versus foundations. While individuals are still the largest source, they account now for only about two-thirds of total giving — whereas they were 82% of the total 30 years ago. This relative decline is less a result of individual giving declining, and more because the share of giving coming from foundations has risen so significantly, from less than 7% in 1992 to nearly 19% of all giving today.
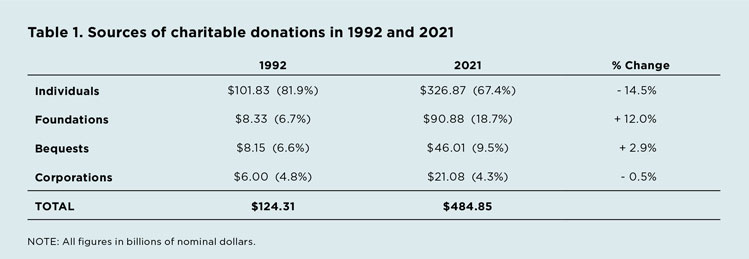
That big increase in foundation giving can be attributed to a lot of causes (e.g., the continued concentration of wealth in the U.S., the incredible growth in the stock market [where foundation assets are often invested], and perhaps even the increasing popularity of “limited-life” foundations that choose to give substantially more than the 5% minimum). But the implications of this shift in giving sources for the sector are major. Foundations have even more power in our field than they did 30 years ago, and fundraisers are rebalancing their efforts away from annual givers and toward institutional and major donors.
“Foundations have even more power in our field than they did 30 years ago, and fundraisers are rebalancing their efforts away from annual givers and toward institutional and major donors.”
Collective and collaborative sources of giving have also increased substantially in the past three decades. Giving circles, while not new in concept, have exploded in practice, especially in the last decade or so. One 2017 study that the Johnson Center co-conducted found the number of giving circles in the U.S. had tripled in the decade prior.
Funder or donor collaboratives have also become increasingly popular and influential. These collaboratives involve institutional (and sometimes large individual) donors working together (e.g., learning and strategizing together, sometimes pooling funds for greater leverage) to tackle a specific problem or advance a shared goal.
Another big shift we can see from Giving USA estimates is in the cause areas that these charitable sources chose to support — or rather, one cause area in particular: religion. While other areas such as human services and education have seen small changes in the percentage of charitable dollars coming their way in this 30-year period, none are as dramatic as religion. In 1992, nearly half of all donations (46%) went to religious causes and organizations. By 2021, that number had fallen to 27%. All signs point to its continued decline.
“[T]he relative prominence and role of religious giving is certainly one of the most significant changes in our sector in the past three decades.”
To be sure, religion still gets more than any other single category — in fact, it gets twice as much as the next largest category, education. But the relative prominence and role of religious giving is certainly one of the most significant changes in our sector in the past three decades. In one sense, this tracks with the decline in individual giving compared to foundation giving, as individuals often give to their house of worship or organizations tied to their faith, while relatively few foundations give to faith-based causes. But it also reflects the overall decline in religiosity in America in recent decades. This has big consequences for the faith-based segment of the nonprofit world — still a sizable segment, but one facing strong headwinds.
The biggest gifts, givers, and giving institutions have always attracted a lot of attention, for obvious reasons. In 1992, the largest foundation by annual grantmaking (and endowment size, as it happens) was the Ford Foundation, which gave $282 million that year. In 2021, however, the largest foundation by grantmaking and endowment size was the Bill and Melinda Gates Foundation, which gave a whopping $5.95 billion in grants.
While the increase in overall giving tracked the growth in the economy, this increase in the biggest foundation donor is significantly larger than the increase in GDP (roughly 270%) across those three decades. If the 1992 giving by Ford had increased the same amount as GDP increased in those years, that $282 million would be a bit over $1 billion in annual giving in 2021. Again, actual giving by Gates in 2021 was nearly $6 billion. Gates is also far bigger now compared to other foundations than Ford was compared to its contemporaries in 1992.
Moreover, individual megadonors have become more prominent as well. No one systematically tracked the biggest donors in 1992, but we can be confident in saying that there was no one giving at levels comparable to Bill and Melinda Gates (who gave $15 billion as individuals in 2021) or Mackenzie Scott (likely more than $10 billion in 2021, but we don’t know the total for sure) or any number of other billionaire donors today. There were far fewer billionaires in 1992, for one thing. And the percentage of wealth held by today’s ultrarich is greater than it was in 1992.
In fact, The New York Times recently pointed out that the No. 1 billionaire on the first Forbes 400 list, put out in 1982, would be ranked No. 182 (tied with several others) on the current list, adjusting his wealth to today’s dollars. Megadonors are clearly more mega now than in 1992 — and this looks like it will continue, as Bill Gates recently announced plans to give another $20 billion from his own fortune, and to increase the foundation’s giving to $9 billion per year by 2026.
Maybe the most widely observed and discussed difference in the giving landscape now compared to 1992 is the number of “donor-advised funds” (DAFs). DAFs of course existed in 1992, mostly as endowed funds at community foundations. But in the years since, not only has the number of DAFs and the contributions being made through them skyrocketed, but the institutions serving as sponsors for these DAFs have diversified.
The National Philanthropic Trust estimates that in 2020, the total number of DAFs exceeded 1 million for the first time (1,005,099), and those DAFs contributed $34.6 billion to charities. Just ten years earlier, in 2010, those estimates were only 184,364 DAFs contributing $7.24 billion. While we don’t have comparable 1992 data, the DAF numbers were surely much smaller then.
While community foundations as DAF sponsors have been a part of this growth — for example, the Silicon Valley Community Foundation, flush with DAFs created from tech fortunes, is now one of the largest foundations of any kind in the country — much of the soaring increase in DAFs has occurred through other types of sponsors.
Most prominent among these are national public charities created by financial institutions to provide easy-to-use, relatively low-fee accounts for donors. It is not an overstatement to say that Fidelity Charitable (launched in 1991), Vanguard Charitable (1997), and Schwab Charitable (1999), among others, fundamentally changed the giving landscape. In fact, if you measure 501(c)(3) public charities by annual contributions (money coming in), Fidelity Charitable is now the largest public charity in the country, surpassing the perennial No. 1 United Way in 2015.