


Using VoiceKent Survey Results to Advance Your Mission
by Melyssa Tsai O'Brien
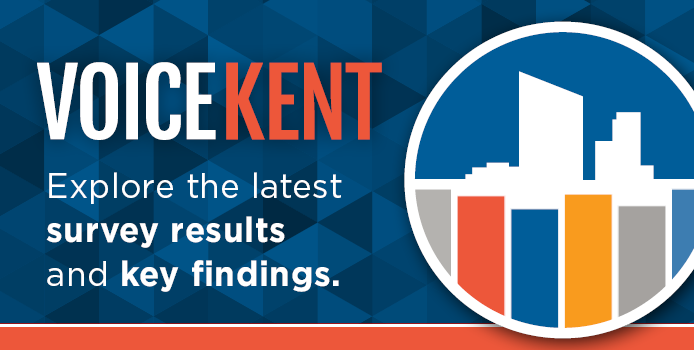
VoiceKent (previously known as VoiceGR) is a county-wide survey about residents’ views and experiences related to health and well-being, discrimination and inclusion, and overall quality of life in Kent County, Michigan. The aim of VoiceKent is to produce a reliable collection of data about Kent County residents that can be used by individuals and organizations to help them make discoveries and decisions about and for the local community.
 The Johnson Center has been conducting community-wide surveys in Grand Rapids and Kent County through our Community Research Institute since 2001. The survey itself has taken a variety of forms — landline telephone surveys, in-person interviews, online questionnaires — but the goal of the survey has always been the same: to amplify the needs and experiences of community residents as they see them in order to help guide local decision-making.
What began as the Greater Grand Rapids Community Survey in 2001 became VoiceGR in 2013. This transition created more space for including community organizations and nonprofits in the survey’s promotion and collection, and it also spotlighted the need to make the data available to the general public.
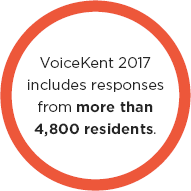
2017 marked the first year of county-wide expansion thanks to a new partnership between the Johnson Center and the Kent County Health Department (KCHD). The VoiceKent 2017 survey was assembled using questions from previous surveys and community health questionnaires, as well as input from various community partners. Survey responses were collected using mixed methods — paper surveys collected in person at community organizations and events and online surveys distributed in a variety of ways.
“Understanding the diversity in the experiences and views of individuals from different demographic groups can promote equity-based and inclusive community decisions.”
An important feature of the survey is that it allows for disaggregation of results, or breaking down results by characteristics like race, gender, and geography. Understanding the diversity in the experiences and views of individuals from different demographic groups can promote equity-based and inclusive community decisions.
Data from the most recent survey, VoiceKent 2017, is available here.
Simultaneously, in the past decade and more, nonprofits and foundations have been placing increased importance on both qualitative (descriptive) and quantitative (numerical) data that can demonstrate the impact of programs and grant dollars. Overall, this is an important and effective trend that can help practitioners in all organizations refine their work and ensure they’re doing the good they are working toward.
But not all organizations have access to the resources or research skills that are needed for extensive data collection and analysis. As the nonprofit sector’s focus on data has grown, the importance of broad community surveys like VoiceKent — and providing free, easy-to-use tools and training to equip nonprofit practitioners and others to find and use this data effectively — has become critically clear.
“As the nonprofit sector’s focus on data has grown, the importance of broad community surveys like VoiceKent has become critically clear.”
That is why we have placed a high value on making VoiceKent survey data available from every year of its collection (including previous VoiceGR surveys). The interactive Tableau Data Visualization Tool is available here to visualize the data that’s most interesting to you or your organization. The tool allows for customizable disaggregation of results splitting the total sample results to show findings among particular subgroups, in order to easily compare how people from various demographic groups answered each of the survey questions.
A quick summary of key findings from the 2017 survey is available here and includes:
Community Leaders. VoiceKent data provides feedback on residents’ overall impressions of life in Grand Rapids and Kent Country and their experiences of racism, feelings of safety, and other factors that speak to overall quality of life. This data is available to inform priority-setting for community governance, business and talent development, inclusive growth, and more.
Nonprofits and Government Entities. VoiceKent data can help you ensure your team is setting program priorities according to community needs. This data can also be useful in fundraising proposals, reports, and other materials to help you define and build the case for your mission.
Foundations and Donors. Place-based and community funding programs are enhanced by quality data that can establish baselines and demonstrate change over time. VoiceKent data can help individuals and organizations identify issue and geographic areas of greatest opportunity and quantify the real-world impact of strategies.
Everyone. Community members have a vested interest in understanding themselves and the local contexts they live within. Families, teachers, business owners — everyone can use VoiceKent data to learn more about their hometown.
When we use data to better understand the realities our neighbors face, we locate the starting point for change. We can target our programs, policies, funding strategies, advocacy efforts, and more for and with populations and places that need them most. We ensure that no one is overlooked or left behind by our collective efforts to do good.