


Introducing Community Insight: A New, Interactive Data Platform
We are proud to share a robust, new data tool for the field: Community Insight.
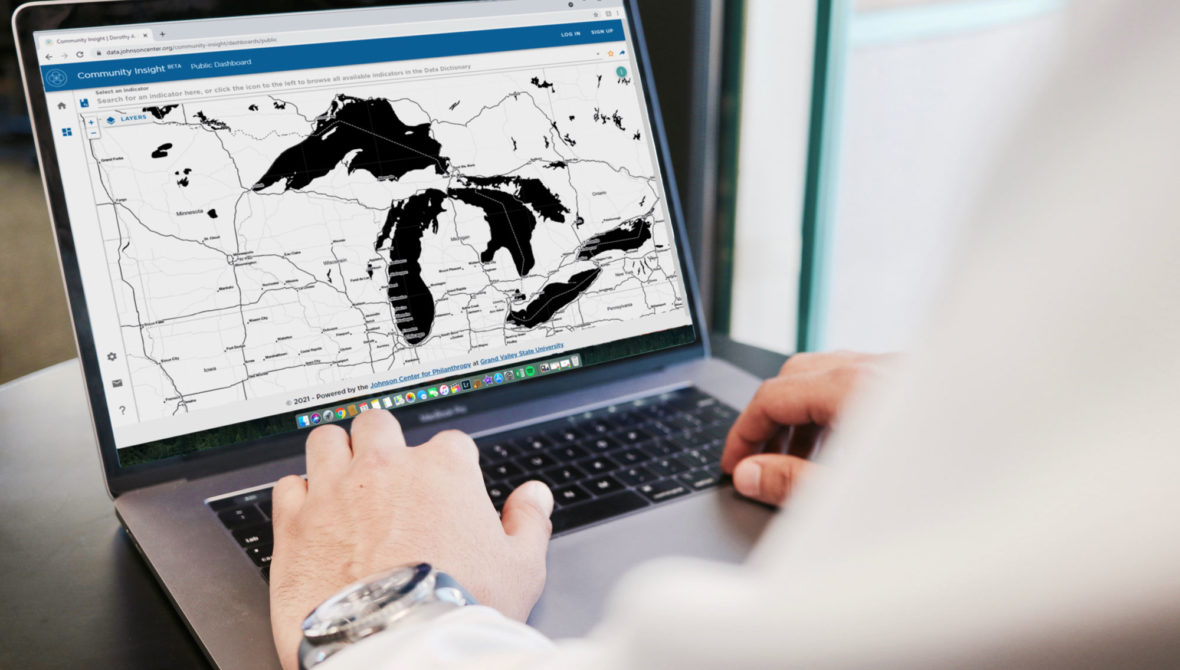
Community Insight is an online platform for displaying data about local communities, understanding community opportunities and needs, and targeting efforts for advancing equity. Community Insight draws on multiple datasets from a range of systems and institutions on topics such as education, health, economic opportunity, population demographics, and more.
This new platform is loaded with a range of datasets to help you visualize the experiences of those in your community. Overlay different indicators of community vibrancy to explore your community’s data and outcomes. For those interested in a customized, consistent view of key indicators in your work, Community Insight offers the opportunity for us to work together to tailor your platform experience.
To help you learn more about how to get the most out of Community Insight, Jeff Williams, director of the Johnson Center’s Community Data and Research Lab, answered a few top questions.
Jeff Williams: Community Insight is, at its core, a data visualization and presentation tool. Many nonprofits and foundations reach out to the Johnson Center for assistance in collecting basic information about their communities and service regions. We realized in 2019 that many of those requests covered the same datasets but for different geographies each time. So we were constantly having to redownload the data from its original source but “tweak” the geography filter with each download.
We knew there had to be a better way, so we started brainstorming what would become Community Insight. We took this idea to Provost Maria Cimitile at Grand Valley State University, who shared our enthusiasm for what a new platform could make possible. We are grateful for the support GVSU provided so that we could build, test, and launch Community Insight.
“Grand Valley State University … shared our enthusiasm for what a new platform could make possible. We are grateful for the support GVSU provided so that we could build, test, and launch Community Insight.”
Community Insight allows us to grab the data once, and immediately post them to a website for both the Johnson Center’s own internal use as well as — most excitingly — for public use. In addition, by grabbing all of the geographies and demographic breakouts — such as age, race/ethnicity, gender, and other variables — all of those cross-tabulations are available as soon as we have the dataset loaded!
That last part is an absolutely critical aspect of Community Insight: to the fullest extent possible, data within the platform can be disaggregated to show different populations’ experiences. Population totals and averages can often hide significant gaps and inequities at the demographic level. We wanted to ensure that any data we make available or use in our own work supports equitable outcomes by making those realities clear.
Additionally, as a bonus for all users, you can download any of the tables and graphs as image files, and we give you access to the raw data via an Excel-readable download. We want to make the data available for anyone to append their own information, run simple statistics in Excel, drop a chart directly into a grant proposal or paper, or even dump the data into Tableau or another visualization tool for expanded analysis.
To launch Community Insight, we’ve provided American Community Survey (ACS) unemployment data at the Census tract level nationwide for the most recent year, as well as the aggregate score of the Centers for Disease Control’s Social Vulnerability Index (SVI) at the county and tract level nationwide for the last three years. For Michigan, we’ve also loaded high school graduation and dropout data for every school district for each of the last three years, as well as the location of every nonprofit in Michigan.
“Each month for the rest of this calendar year, we’ll be adding another dataset, including population, educational attainment, poverty, and household income data for all Census tracts and counties throughout the nation.”
Each month for the rest of this calendar year, we’ll be adding another dataset, including population, educational attainment, poverty, and household income data for all Census tracts and counties throughout the nation. We’ll grab the components of SVI at the Census tract and county level, and load those as well. We’ll also load the location of every nonprofit in the United States, along with basic financial information. And, as mentioned above, wherever the data is available, we’ll be loading demographic cross-tabulations — such as race/ethnicity, gender, and age — as we load the primary data.
It’s a lot of information! That’s why we’re staging the data loads each month. There’s no reason to hold off making the site public until the last data is available.
We did our first public demonstrations in April 2021 as the final pre-launch “shakedown cruise” and received great feedback.
During the tours, we use a couple of case studies — one in Michigan, and one in another state — to show users how Community Insight data can be queried, sorted, and downloaded. We show how Community Insight views can be saved to your account as well as shared with other users.
In the coming months, we’ll also be recording some of those case studies into short tutorial videos and adding those to the site for reference. As we load more and more data, we’ll start to pivot our attention to building out the customized data views.
Great question — we got this during our first public demonstration, too. The public views are free and available to anyone without a registered account. You can query, view, and download any of the public data we have in Community Insight. If you want to “save” a view you created, you need to register for a free account. But if you just want to “share” a view you created, you can do so without registering.
“The public views are free and available to anyone … The custom data views are for nonprofits and foundations that have their own data they would like added — or layered on top of — what we already have in Community Insight.”
The custom data views are for nonprofits and foundations that have their own data they would like added — or layered on top of — what we already have in Community Insight. For example, a foundation may want to display information about each of its grantees on the Community Insight map so they can see their grantees in relation to demographic information about the communities served. A nonprofit may want to display program enrollment data over the last 10 years to track how its programs evolved to serve changes in population in their service region. Or a regional economic development agency wants to show their board outcomes information from the investments in local businesses, grouped by economic development program.
In each of those examples, the sponsoring organization may want their additional data to be private to their members, staff, or board of directors — and we can make that happen with a customized Community Insight dashboard. Custom, or private, dashboards can use all of the public data plus any data loaded to the private view. In addition, custom dashboards can include other public data sets – such as health outcomes data – that an organization wants to load on just a regional — not state or national — basis.
Any organization interested in exploring other public or private datasets, as well as in a customized dashboard, can reach out to me or any of the members of the Johnson Center team. We’re already exploring customized dashboards with a half dozen organizations that saw the first public demonstration or that are current clients of the Johnson Center.
Community Insight is the natural successor to both of those prior efforts. The original Community Profiles was similar to a fact sheet for neighborhoods and communities in and around Grand Rapids, Michigan, where the Johnson Center is located. Community Profiles 2.0 moved much of that data out of a fact sheet format and into simple maps and charts but still was mostly centered in and around Grand Rapids.
With Community Insight, we’re taking what we learned from those projects and other data dashboards operated by the Johnson Center and going national — wherever possible, we’re starting at the Census tract level and going up through the county level across the country. We’re still committed to making robust data available at the local level — that is, in and around West Michigan — and will be migrating much of the CP and CP 2.0 data into Community Insight in the coming months.
The Community Insight webpage is the best place to find the latest information, along with the Johnson Center’s email newsletters and social media channels. And yes, the looming release of Census data sometime in 2022 is another reason why we are excited to launch Community Insight this year. Our goal is to load a good baseline set of trend data across the country so that we are ready to display Census 2020 data quickly and easily when it is released.
We hope that Community Insight helps nonprofits, foundations, and other philanthropy stakeholders find, display, and use data from multiple sources faster than ever before!