As part of the data and analysis team at the Johnson Center, one question crosses my desk more than almost any other: “What does the nonprofit and philanthropic landscape actually look like in our backyard?”
Community leaders, grantmakers, and nonprofit executives are constantly seeking clear answers to essential questions:
In most cases, the data we produce at the Johnson Center isn’t just for curiosity’s sake — it’s built to be shared directly with boards, community partners, and policymakers to drive strategic decision-making.
Yet, answering these questions consistently across regions has always faced a major hurdle: the geography dilemma.
Finding reliable data that simultaneously captures nonprofit capacity, foundation resources, and community need in a single, comparable view is notoriously difficult.
Most public data is organized by county. But counties vary widely in population, from dense urban centers with over a million residents to rural counties with fewer than 25,000 residents. When you compare raw numbers across counties, are the differences driven by structural philanthropic realities or simply by population size? Furthermore, neither community need nor philanthropic grantmaking neatly stops at county borders.
To solve this, we looked at regional data through an underutilized lens: U.S. Congressional Districts.
Organizing philanthropic data at the congressional district level provides three immediate advantages:
Today, we are excited to launch Philanthropy Insights, an open-access, fact-sheet-style tool designed to bring clarity to local philanthropic ecosystems.
Each district profile brings together core metrics across three vital pillars:
Crucially, every metric is benchmarked against the state average, instantly indicating whether a district is above or below the comparative baseline.
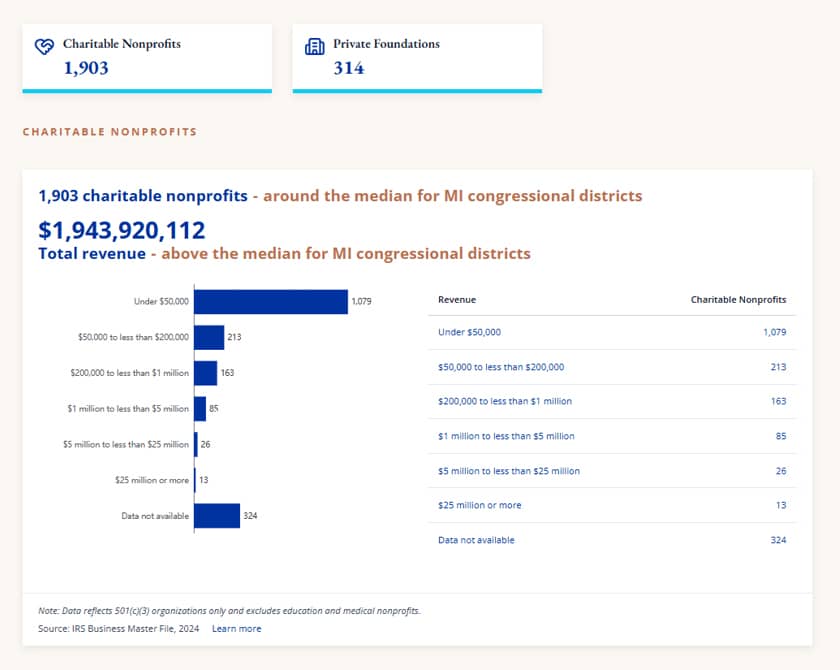
In 2026, Michigan will be electing a new governor, secretary of state, and attorney general, due to term limits. In addition, our full state house and state senate are up for election (or re-election) at the same time. Therefore, we decided to launch Philanthropy Insights as a pilot in our home state of Michigan. We gathered a basic set of core data for each of Michigan’s 13 congressional districts — but our vision is national.
As we test this model, we want to hear from changemakers across the country:
Whether you are preparing a briefing for newly elected legislators, engaging with your grantees and nonprofits, or writing your next major grant proposal, we hope Philanthropy Insights equips you with the data you need to drive meaningful community impact.
Explore the Philanthropy Insights dashboard and let us know what you think!