On July 31, the CDC eviction and the Federal Housing Finance Agency foreclosure moratoriums expired (the single family home eviction moratorium is set to expire September 30, 2021), leaving millions of renters and homeowners vulnerable to displacement from their homes and communities. These housing protections have disparate impacts for Asian American and Pacific Islander (AAPI) communities, each of whom has unique housing needs and challenges.
Despite being the fastest-growing racial group in the U.S., AAPI residents are often left out of the national conversation when it comes to housing needs. The housing field must acknowledge that there is a long history of overlooking the needs of AAPI residents in this field and continue to affirm the challenges low-income AAPI households face, using disaggregated data where possible, as the nation transitions into a COVID-19 recovery.
A 2018 Pew Research Center report showed that income inequality increased most among Asians from 1970 to 2016, making them the most economically divided racial and ethnic group in the United States (Kochhar & Cilluffo). Historically speaking, waves of Asian immigration and forced migration have created extreme wealth inequalities for AAPI communities. When AAPI communities are lumped together as one — as so often happens — the differences between subgroups in the AAPI umbrella are erased and research does not serve those who are most vulnerable. This is exacerbated by the “model minority” myth, or the notion that Asian American residents are model citizens who succeeded in the U.S. based on merit, boasting high educational achievement (Center on the Legal Profession, 2018; Chow, 2017).
“When AAPI communities are lumped together as one — as so often happens — the differences between subgroups in the AAPI umbrella are erased and research does not serve those who are most vulnerable.”
The “model minority” myth perpetuates the idea that Asian American citizens are wealthier compared to other communities of color. Yet, Asians in the top 10% of the income distribution earned more than 10 times as much as Asians in the bottom 10%, according to the Pew Research Center (Kochhar & Cilluffo, 2018). This narrative is harmful both in perpetuating the stereotypes that Asians are economically well-off (erasing the experiences of those who are lowest income in our community), while also perpetuating anti-Blackness by using Asian “economic mobility” as a justification for blaming Black and Latinx communities for their lack of wealth (Center on the Legal Profession, 2018; Chow, 2017).
This creation of a “wedge” between Asian and other communities of color is part of the logic of white supremacy, which seeks to divide communities of color from one another. What is missing in this narrative is the important context of how immigration policies have shaped the demographics of the Asians who have migrated to the United States.
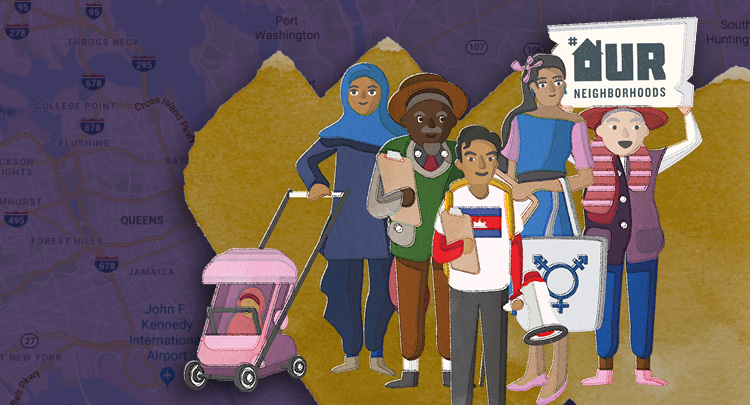
 Photos courtesy of National CAPACD
Since 1965, policies have sought to increase skills-based migration, and a growing share of Asian immigrants, including those from wealthy, highly educated backgrounds, have been encouraged to immigrate to the United States from Asia, while others have been barred from entry. Those from lower-income backgrounds — refugees, asylees, undocumented immigrants, and low-wage workers — as well as those who have resided in the U.S. for longer periods, are living a different economic reality from those who are able to immigrate here because of their skills and education background.
The AAPI monolith is particularly damaging to newer waves of immigrants and refugees — Burmese, Bhutanese, Laotian, Cambodian, and Hmong, for example — who often arrive in economic distress, having experienced forced displacement due to war and occupation in their home countries. Their later arrival, compared to other, more established AAPI communities in the United States, also impacts their economic mobility and sets their realities apart from a single narrative.
Many Native Hawaiians or Other Pacific Islanders (NHOPIs), despite being the original inhabitants of many of the islands now legally a part of the United States, experienced similar displacement under imperialism and colonialism. Their socioeconomic status, in many cases, continues to reflect the brutal history they’ve endured.
As the nation enters a period of uncertainty for those threatened by these expiring protections, the housing field has a responsibility to accurately portray the diverse experiences and challenges of AAPIs using disaggregated data, where possible and appropriate, for different AAPI ethnic subgroups.
The latest data on homeownership disparities indicate that in 2019, the Asian-white homeownership gap (12%) fared much better than the Black-white (30%) and Hispanic-white (24%) homeownership gaps (Joint Center for Housing Studies of Harvard University, 2021). It’s important to note that comparing AAPI homeownership here with other racial groups is not intended to repeat the mistake of placing a “wedge” between communities of color, but rather to add nuance to a data point that doesn’t account for the diversity of the AAPI population. This aggregate data can be misleading when considering the enormous wealth gap between the wealthiest and lowest-income AAPI residents and contributes to the false notion that they are “well off” and don’t require housing assistance.
In fact, AAPI populations have a lot in common with other communities of color. The State of the Nation’s Housing 2021 report showed that Asian homeowners were on par with Black and Hispanic homeowners who were behind on mortgage payments in early 2021 — more than twice the share of white homeowners behind on mortgage payments. Similarly, more than a third of low-income Black renter households and a quarter of Asian and Hispanic renters were behind on rent in early 2021, compared to 17% of low-income white renters (Joint Center for Housing Studies of Harvard University). NHOPI residents face a completely different set of housing challenges: the National Alliance to End Homelessness identified that the NHOPI population has the highest rate of homelessness in America (2020).
The fallout from these expiring pandemic protections may have unprecedented consequences for low-income AAPI homeowners and renters. In March, the National Coalition of Asian Pacific American Community Development (National CAPACD) and our partners at the University of California, Los Angeles, released a research report on the state of housing for low-income AAPI homeowners and renters since the Great Recession in high-cost housing markets (seven metropolitan statistical areas that comprise one-third of the nation’s total AAPI population) (Pech et al.).
This research was conducted before the COVID-19 pandemic. It provides a snapshot of the housing challenges of a majority of low-income AAPI residents who live in high-cost housing markets and large metropolitan regions. The report analyzed data for AAPI households on the edge of financial vulnerability by identifying AAPI households who were severely cost-burdened (households that spend more than 50% of their household income on housing costs). We can extrapolate findings from this report to identify those communities that are most likely to be impacted by expiring pandemic protections: 26% of Asian and 27% of NHOPI renters are severely cost-burdened (p. 34), and 16% of Asian and 12% of NHOPI homeowners are severely cost-burdened (p. 32).
The eviction moratorium is also likely to produce more disparate impacts for low-income communities as nearly 6.4 million households are currently behind on rent (National Equity Atlas, 2021). The State of the Nation’s Housing 2021 shows that more than three-fifths of renters earning less than $25,000 were severely cost-burdened in 2019 before the pandemic (p. 32).
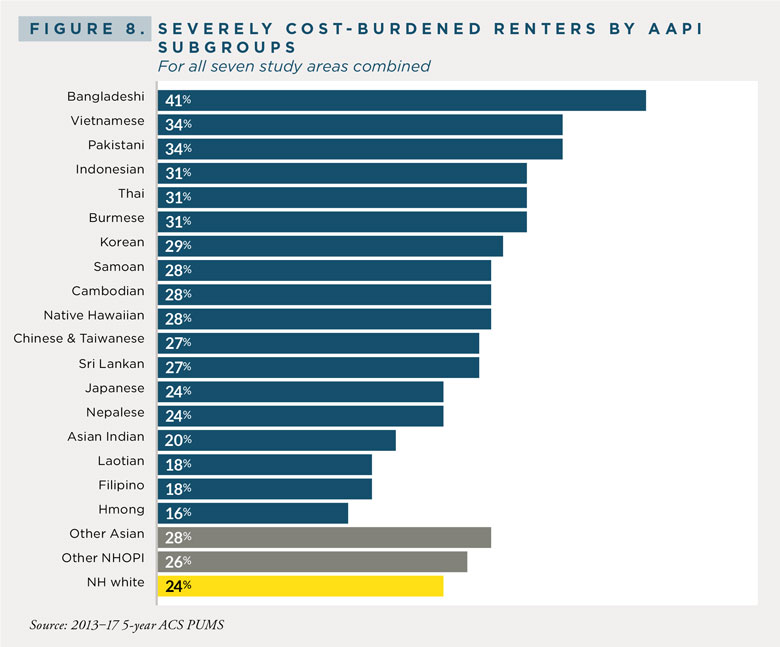
Analyzing severely cost-burdened renters using disaggregated data also shows disparities by AAPI subgroups where, for example, Bangladeshi renters are nearly two times as likely to be severely cost-burdened than white renters (Figure 8). When analyzing the demographic characteristics of severely-cost burdened households, more than half (54%) of Asian households are Limited English Proficient as opposed to white households (9%), posing challenges for how to best serve this diverse population that speaks many different languages and is unlikely to be able to access critical rent relief programs (National CAPACD, 2021).
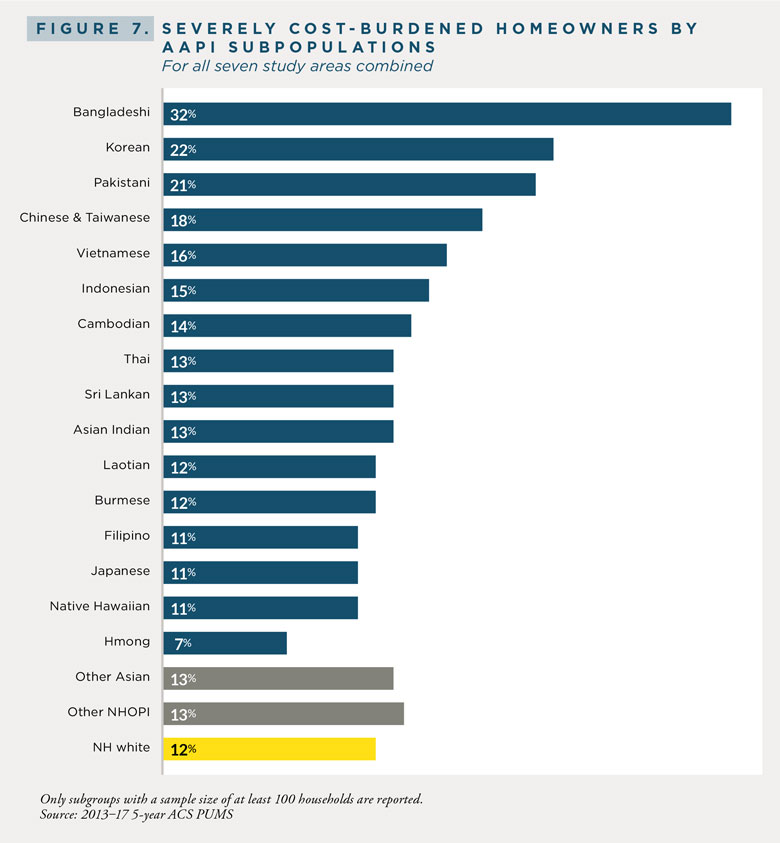
This chart from the National CAPACD report shows the distribution of severely cost-burdened homeowners by AAPI subpopulations when broken down by country of origin (Figure 7). Bangladeshi homeowners are the most severely cost-burdened. The aggregate 59% Asian American homeownership rate data point erases these enormous differences between AAPI subgroups (Budiman & Ruiz, 2021). Disaggregating data allows for the unique housing challenges of Bangladeshi communities to be amplified to the national level, for example.
Another example of where data disaggregation is helpful is the Consumer Financial Protection Bureau’s analysis of AAPI mortgage data (Dobre & Young, 2021):
The denial rates of some AAPI subgroups, such as Japanese (6 percent) or Korean (8 percent) looked similar to that of non-Hispanic White borrowers while the denial rates of Hawaiian or Pacific Islander (HoPi) and some Asian subgroups were closer to those of Black and Hispanic White borrowers. For example, Vietnamese, Native Hawaiian, Guamanian, and Samoan applicants had denial rates ranging from 13 to 15 percent. (para. 7)
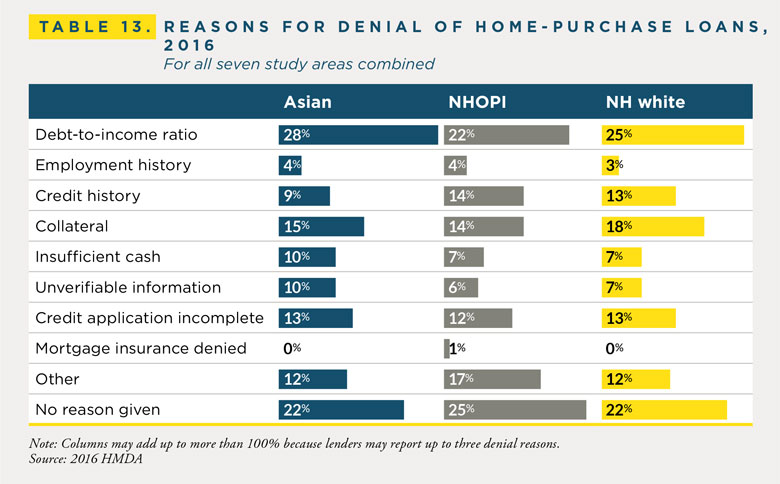
National CAPACD’s (2021) research on mortgage denial reasons shows Asian households to have a higher propensity for being denied loans due to high debt-to-income ratios (28%) and unverifiable information (10%) where inaccuracies in an applicant’s employment history or tax records could lead to a mortgage loan denial. This data furthers the notion that AAPI households are increasingly on the edge of financial vulnerability and that many AAPI homeowners are overleveraged at different rates. Yet again, NHOPI residents face a different set of challenges, as the report identified that NHOPIs were more likely than whites to have a subprime loan which usually charges interest rates above the prime lending rate. The share of mortgages with a subprime rate for NHOPI households was more than four times higher than for whites in the Honolulu metropolitan area.
As the Biden administration pushes for a whole-of-government approach to soften the blow of expiring pandemic protections, and Congress mulls over various pieces of housing legislation, the housing field must account for the unique needs and challenges that different low-income AAPI subgroups face by using disaggregated data where possible and not painting the AAPI community in broad strokes.
“Although AAPI populations are perceived as a cohesive racial category, disaggregated data shows AAPI experiences vary widely and that a one-size-fits-all approach does not work for a racial group that is deeply economically divided.”
Although AAPI populations are perceived as a cohesive racial category, disaggregated data shows AAPI experiences vary widely and that a one-size-fits-all approach does not work for a racial group that is deeply economically divided. AAPI residents are both low and high skilled workers. They are fourth-generation Japanese Americans and newly immigrated Burmese Americans. They range from food service workers to healthcare providers — many of whom were “essential workers” during this past pandemic.
The fallout from the expiring eviction and foreclosure moratoria may give rise to the same mistakes from the last recession where communities of color were displaced from their homes, further widening the AAPI household wealth gap and wealth inequality in the United States. We urge the administration and Congress to take heed of our lessons learned in their policies and protections to facilitate a post-COVID recovery.
Budiman, A., & Ruiz, N. G., (2021, April 29). Key facts about Asian Americans, a divers and growing population. Pew Research Center. https://www.pewresearch.org/fact-tank/2021/04/29/key-facts-about-asian-americans/
Center on the Legal Profession. (2018). Asian Americans in the law. The Practice. 5(1). https://thepractice.law.harvard.edu/article/the-model-minority-myth/
Chow, K. (2017, April 19). ‘Model Minority’ myth again used as a racial wedge between Asians and Blacks. NPR. https://www.npr.org/sections/codeswitch/2017/04/19/524571669/model-minority-myth-again-used-as-a-racial-wedge-between-asians-and-blacks
Dobre, A., Jo, Y. (2021, July 1). Challenging the model minority myth: A closer look at Asian American and Pacific Islanders in the mortgage market [Blog]. Consumer Financial Protection Bureau. https://www.consumerfinance.gov/about-us/blog/challenging-model-minority-myth-asian-american-pacific-islanders-mortgage-market/
Joint Center for Housing Studies of Harvard University. (2021). The state of the nation’s housing 2021. https://www.jchs.harvard.edu/sites/default/files/reports/files/Harvard_JCHS_State_Nations_Housing_2021.pdf
Kochhar, R., Cilluffo, A. (2018, July 12). Income inequality in the U.S. is rising most rapidly among Asians. Pew Research Center. https://www.pewresearch.org/social-trends/2018/07/12/income-inequality-in-the-u-s-is-rising-most-rapidly-among-asians/
National Alliance to End Homelessness. (2020, June 1). Racial inequalities in homelessness, by the numbers. https://endhomelessness.org/resource/racial-inequalities-homelessness-numbers/
National Equity Atlas. (2021, July 5). Rent debt in America: Stabilizing renters is key to equitable recovery. https://nationalequityatlas.org/rent-debt
Pech, C., De La Cruz-Viesca, M., Calderon, C., & Ong, P. (2021, March). Crisis to impact: Reflecting on a decade of housing counseling services in Asian American and Pacific Islander communities. National Coalition of Asian Pacific American Community Development; University of California, Los Angeles. https://www.nationalcapacd.org/wp-content/uploads/2021/03/NationalCAPACD_HousingCounselingReport_final_031221.pdf