In July 2020, the U.S. Department of the Treasury and the U.S. Small Business Administration (SBA) released dozens of summary data files about organizations — nonprofit and for-profit — that received loans under the Paycheck Protection Program (PPP).
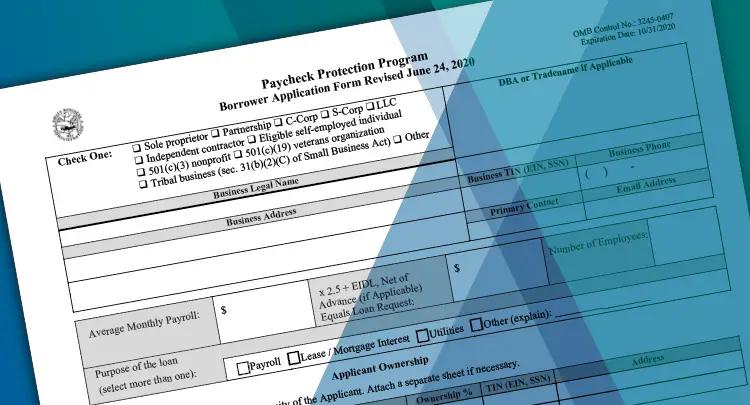
Up to $669 billion in loans was made available through an application process for all entities with 500 or fewer employees (or that met other, more limited special criteria). Loan amounts were capped at 2.5 times the organization’s monthly payroll costs, with a maximum loan of $10 million.
The data files from the first round of funding were released in two sets:
Many news organizations and nonprofit advocates quickly analyzed the larger loans in articles in The Chronicle of Philanthropy or Nonprofit Quarterly, for example. But Johnson Center researchers were curious about the Paycheck Protection Program loan universe as a whole — so we combined the 58 total data files and nearly 4.9 million records to determine, first, how nonprofits fared under PPP, and then to consider the impact of the program on nonprofit employment.
Here’s what we learned.
When we take a look at the full pool of Paycheck Protection Program loans, we see that:
1. Nationwide, nonprofits received 3.7% of all loans made under this program.
Nearly 182,000 nonprofits received a PPP loan, out of the nearly 4.9 million total loans.
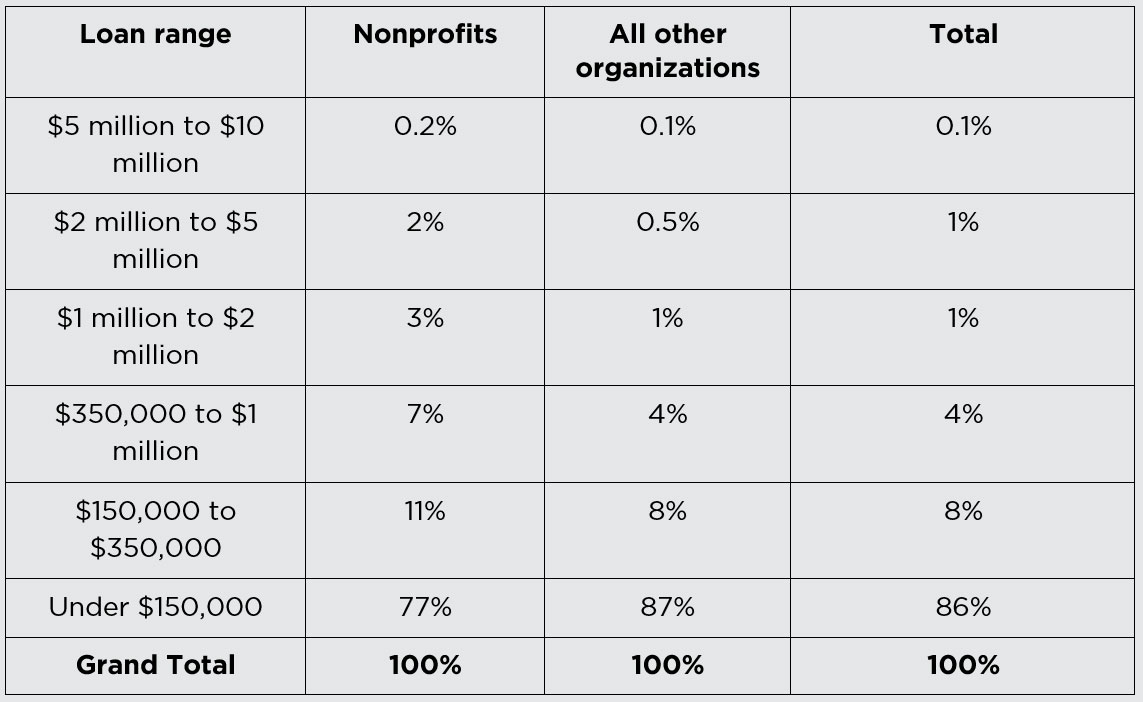
2. Nonprofits received a larger share of the high-dollar loans than all other entity types.
The data allowed us to see what percentage of applicants received loans within each range. As you can see in Table 1, nonprofits fared better than other types of organizations in their efforts to secure loans over $350,000.
3. Those 181,680 nonprofit PPP loans protected 4.1 million nonprofit jobs.
Using the latest national nonprofit job figures from the Bureau of Labor Statistics or Johns Hopkins University (12.3 million jobs), this means that nearly one in three nonprofit jobs nationwide was protected by PPP funds.
4. Nearly 90% of all PPP lenders made at least one loan to a nonprofit.
Paycheck Protection Program loans were distributed through financial institutions such as banks and credit unions. The combined PPP loan database lists 4,891 separate active lenders. Of those, 608 did not make any loans to a nonprofit. That leaves 4,258 that did — meaning 88% of all lenders made at least one loan to a nonprofit organization.
5. A typical lender made approximately 4–5% of their total loans to a nonprofit.
The typical lender — measured by either median or average — made between 4% and 5% of their total loans to a nonprofit. The largest share of lenders (1,134) made 2-5 total loans to a nonprofit at the low end; at the upper end, 22 lenders made more than 1,000 total loans each to nonprofits. Lenders ranged from the largest commercial banks in the United States to some sector- and community-restricted credit unions (including more than a dozen that made half or more of their total number of loans to nonprofits).
The national numbers are clearly helpful. But a better measure of the effect of Paycheck Protection Program loans on the sector would be to examine how many nonprofits that were eligible to receive PPP funds were successful in their applications — and how many eligible nonprofit jobs were protected.
PPP loans were available to any organization with 500 or fewer employees — which also means an organization had to have at least one employee. Based on the Johnson Center’s work with IRS Form 990 filings, we know:
Therefore, in order to determine how many nonprofits were actually eligible to apply for relief under the Paycheck Protection Program (what we’re calling our “Best Eligible Estimate”), we counted up all the 990 and 990-EZ filers, then deleted from that record set all 990 filers with more than 500 employees. We ended up with a total of about 452,000 nonprofits nationwide.
This Best Eligible Estimate likely overstates the number of nonprofits that were truly eligible for the program, given that not all 990-EZ filers have an employee, but it is a good place to start. (See the first endnote below for more information on this.)
Approximately 40% of eligible nonprofits received a PPP loan.
Knowing that a total of 181,680 loans were made and that 451,966 nonprofits were eligible to receive them (remember, it’s one loan per organization), a quick calculation shows that only about 40% of eligible nonprofits received a PPP loan.
Now, that number is nationwide. What happened at the state level?
Caveat: That 40% national average masks large variations by state.
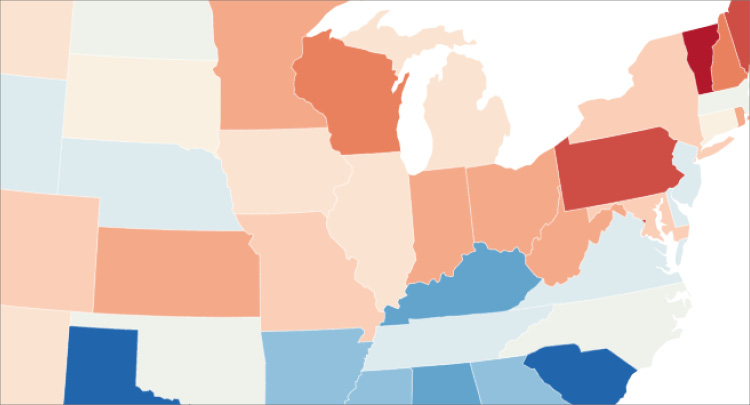
For purposes of illustration, we looked at the total number of PPP loans made to nonprofits in each state as a percentage of the Best Eligible Estimate (again, meaning our best guess at the number of program-eligible nonprofits that exist in that state). Successful applicants ranged from a low of 28% to a high of 67%, by state.
Nonprofits appear to have done particularly well in South Dakota, Alabama, Kansas, Nebraska, Oklahoma, and Mississippi. In each of those states, more than 55% of all eligible nonprofits (based on the Best Eligible Estimate in each state) received a PPP loan.
States that appear to have done less well — with fewer than a third of Best Eligible Estimate organizations receiving loans — were Utah, Idaho, Arizona, Montana, and California.
The share of nonprofit jobs protected varied greatly by state, as well. To determine these numbers, we first calculated the total employment of all Best Eligible Estimate nonprofits in each state (based on 2017 data). That group accounts for 6.5 million of the estimated 12.3 million national total (also a likely undercount, as not all organizations list the number of staff on their 990 form). We then looked at the employment data and the PPP data together to identify which states had the highest percentage of jobs protected by the program.
Mississippi, Texas, Alabama, Oklahoma, Nevada, and Louisiana all had more than 90% protection of estimated eligible nonprofit jobs. Conversely, the District of Columbia, Rhode Island, Alaska, Washington, Virginia, Connecticut, Oregon, and Vermont protected less than 50% of estimated eligible nonprofit jobs.
Nationally, nonprofits received 7% of total loan dollars.
As we mentioned above, due to the way that the data was released, actual loan values are available only for loans under $150,000. For loans above that amount, each record gives us a range of loan values.
Still, we were able to estimate the total value of loans given out to nonprofits under PPP (for our methodology here, see the second endnote below). By our calculation, nonprofits received (Table 2):
Click table to magnify.
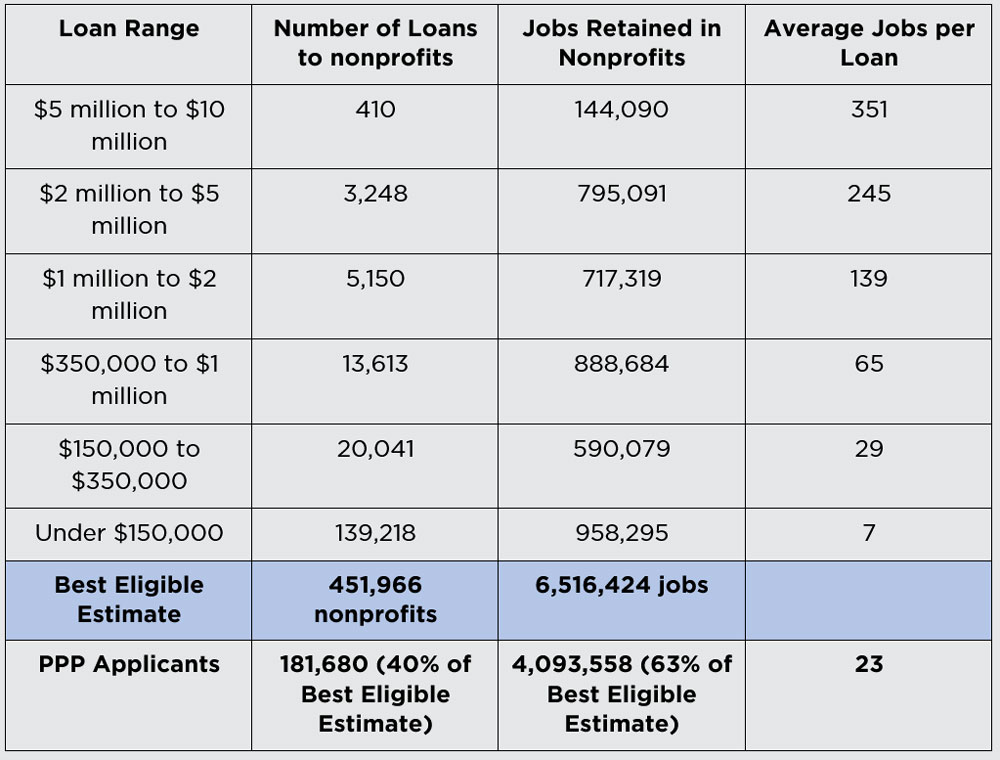
Nearly two-thirds of eligible nonprofit jobs were protected by PPP loans.
Using that Best Eligible Estimate again, we calculate that nearly two-thirds of eligible nonprofit jobs were protected by PPP funds (Table 3). That conclusion loosely tracks with the SBA’s estimate that as much as 84% of all small business employees (in this case, “small business” includes nonprofits with fewer than 50 employees) were protected by PPP loans.
There’s a catch.
Here it is: across industries, the data from the SBA shows that 51.1 million jobs were protected by PPP loans. Given that nonprofits represent approximately 10% of the workforce, we would expect to see at least 5.1 million jobs retained by nonprofit PPP applicants. That number is noticeably higher than the 4.1 million nonprofit jobs that the data show were actually impacted by PPP loans. So, what happened?
When we marry these two facts, 1) that nonprofits received a larger share of the $150,000+ loan category than other organizations, and 2) that the number of nonprofit jobs PPP protected was approximately 20% less than expected, we can conclude that while larger nonprofits were successful in PPP, smaller nonprofits may not have applied for loans or have not been successful with applications so far.
In early July, the President and Congress extended applications for the PPP program through August 8, 2020. With $138 billion in funds remaining under the program — and with evidence that fewer nonprofits than expected (especially smaller nonprofits) applied or were successful in Round 1 — the nonprofit sector and its advisors should redouble efforts to reach out to PPP-eligible nonprofits who may need assistance in applying during Round 2. As to which types of organizations may need assistance, we point readers back to our prior blogs on cash on hand and risks facing nonprofits.
1. There is a second way to estimate the number of PPP-eligible nonprofits.
A different — and, we believe, less reasonable — estimate of the universe of PPP-eligible nonprofits would be our Best Eligible Estimate count plus all 990-N filers. While most 990-N filers do not have a single employee, it is possible they may qualify for PPP loans under other criteria, and also might have other PPP-eligible expenses, such as rent.
Given the descriptions above, the Johnson Center believes that the actual number of eligible nonprofits lies much closer to our Best Eligible Estimate than to this broader second estimate — but we present both figures below for transparency.
| Total loans | Estimated eligible nonprofits | Share receiving PPP loans |
| 181,680 | 451,966 (Best Eligible Estimate) | 40% |
| 181,680 | 1,350,851 (broadest estimate) | 13% |
2. How we calculated the nonprofit share of larger loans
As stated above, due to the way that the data was released, actual loan values are available only for loans under $150,000. For loans above that amount, each record gives a range of loan values.
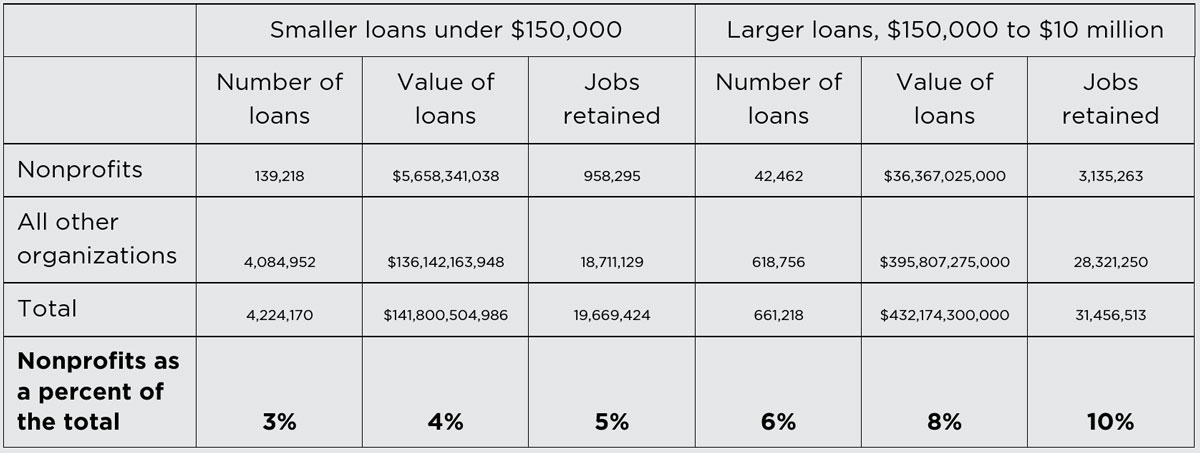
What we know for certain — based on the early July data release — is that the total value of all loans to all applicants under $150,000 was $142 billion, made in 4.2 million separate loans.
Of this amount, the SBA data clearly shows that nonprofits received $5.7 billion (4% of the value of all smaller loans) in 139,218 loans (3% of all smaller loans).
We also know for certain that nonprofits received 42,462 loans issued above $150,000 (6% of larger loans) — but because those loans were marked in ranges, as opposed to specific loan values, we do not know for certain each recipient’s loan value. Therefore, we are missing a precise loan value for nonprofit organizations.
But based on the overall program statistics, the SBA has given us enough information to make a very good estimate. The overall program statistics, as of June 30, reported by the SBA show:
When Johnson Center researchers set the value of each loan above $150,000 to the median of its range (but continue to include the number and value of loans under $150,000 in our total calculations), we get
Therefore, as a near estimate, we can proceed with the midpoint of each range. With these estimates, we calculate that nonprofits received 8% of the value of larger loans over $150,000 ($36.4 billion).